
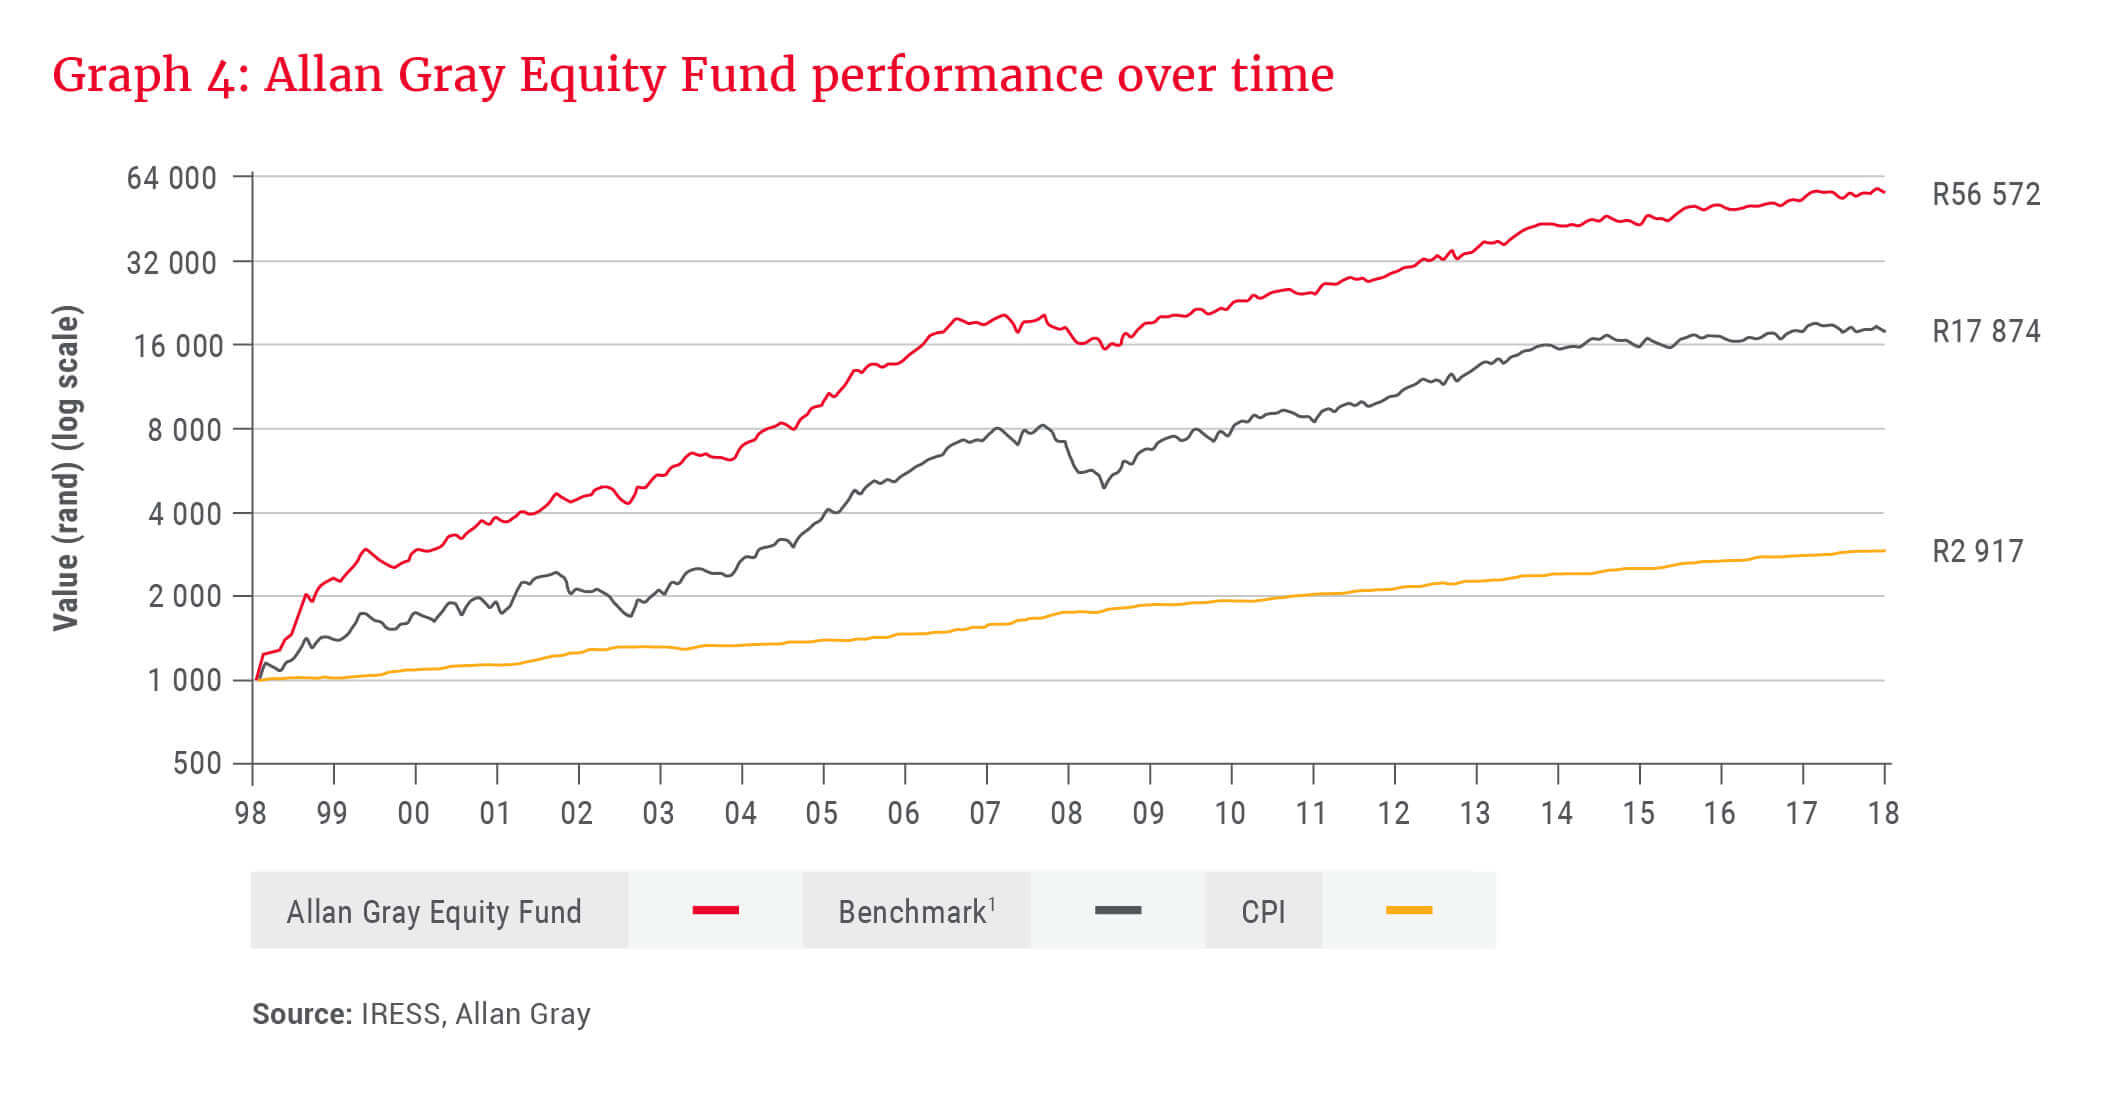
If you had invested R1 000 in the Allan Gray Equity Fund when it was launched on 1 October 1998, it would be worth R56 572 today (at 30 September 2018). A similar investment in the benchmark would be worth R17 874. As Allan Gray’s first unit trust celebrates its 20th anniversary, Julie Campbell, who as an Allan Gray employee was given a celebratory R1 000 investment at the launch of the Equity Fund and who has remained invested, looks at the Fund’s positioning over time and how our investment philosophy has been applied to achieve its objectives.
The Allan Gray Equity Fund was launched against the backdrop of one of the most significant periods of underperformance in Allan Gray’s history. Our clients’ portfolios in 1997 and the start of 1998 had almost no exposure to technology and financial services companies, which performed exceptionally well despite our assessment that they were overvalued. Instead, our clients’ portfolios were heavily weighted towards resource stocks, which were out of favour despite our research indicating that they were undervalued by the market. The three-year trailing relative share underperformance as at 31 March 1998 was 6%.
Subsequently, between 20 April and 11 September 1998, the local stock market declined 42% from its peak. During this period, market sentiment reversed and financial and technology shares slumped dramatically. Despite heightened market fear, the risk of further market weakness seemed low, and we believed that the potential returns from investing in equities seemed especially attractive. We considered it an opportune time to begin our journey into the unit trust industry and launched the Equity Fund to open our doors to a much broader pool of investors, for whom we believed we had the ability to generate long-term outperformance. Allan Gray was the last of the top 10 institutional managers at the time to launch a unit trust.
Some things change …
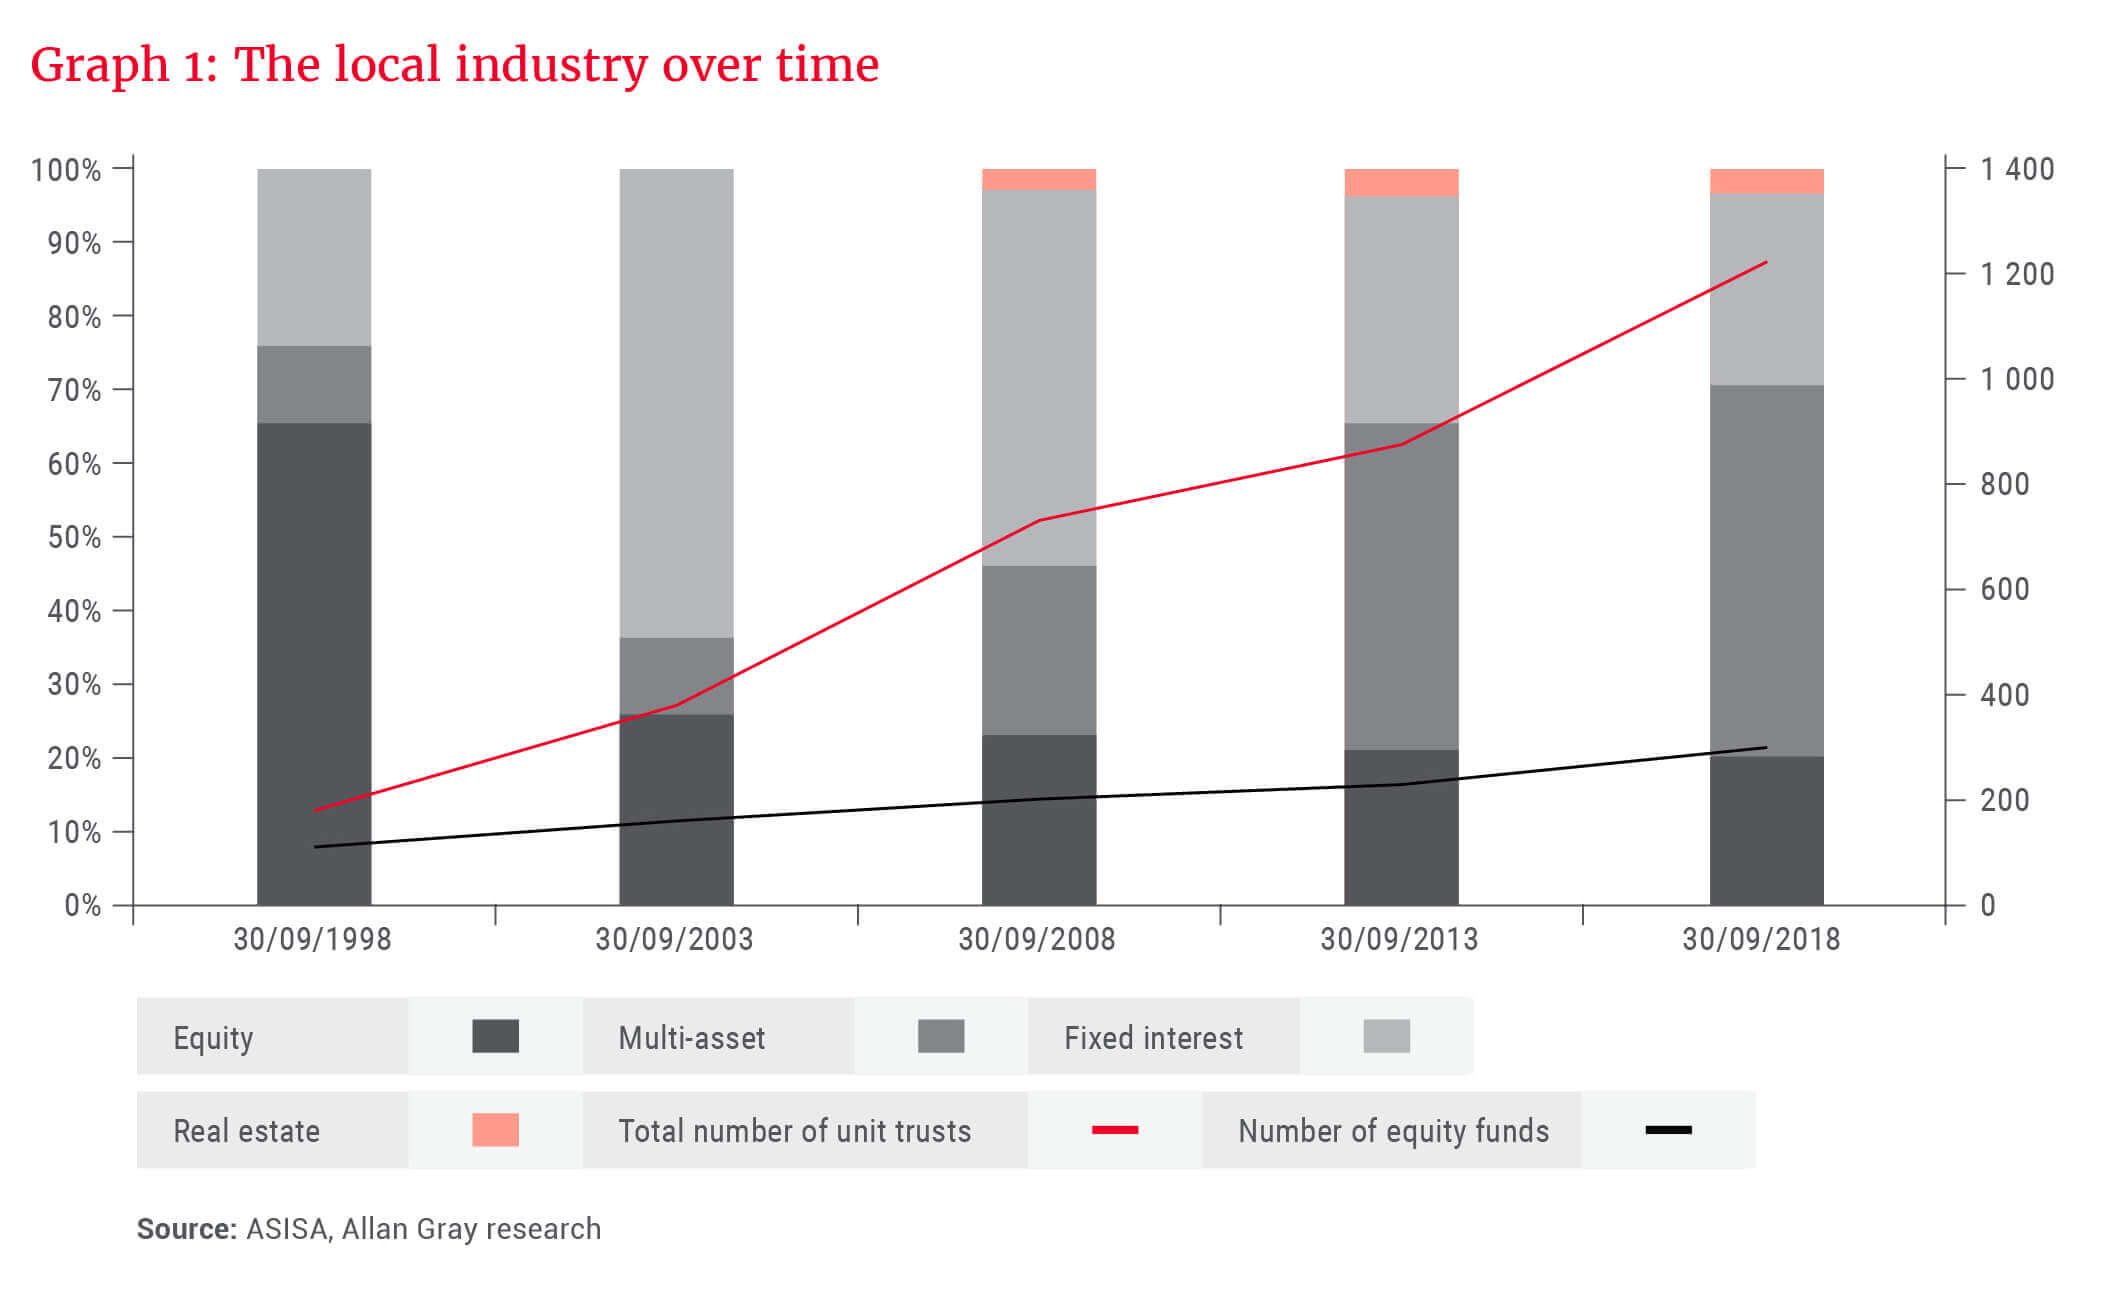
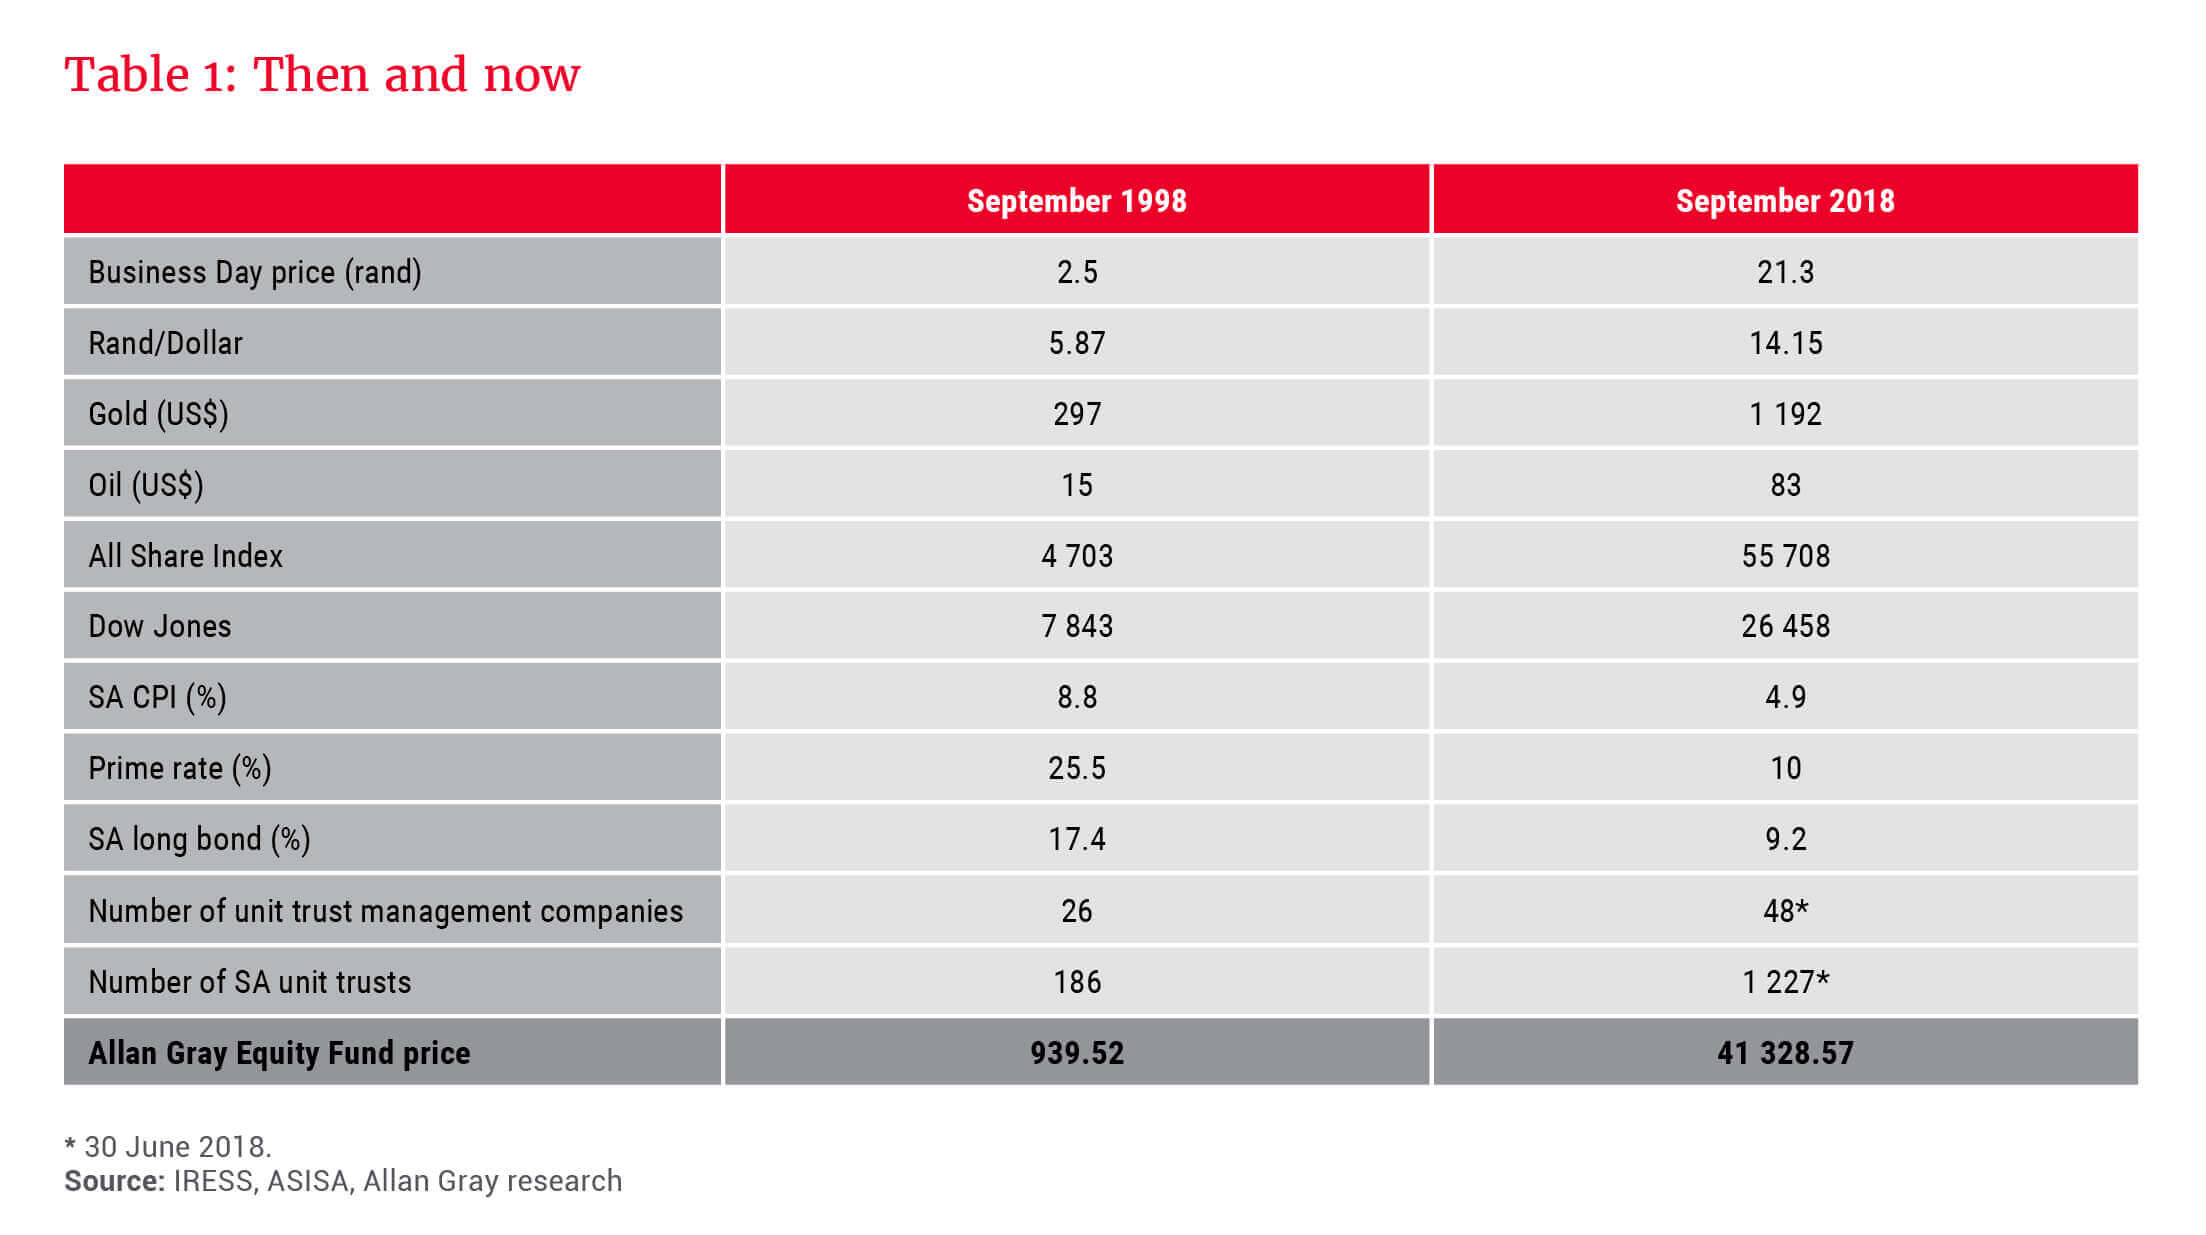
Of course the industry landscape has changed a lot since then, as can be seen in Graph 1. After the significant market volatility and downturns in 1998 and the early 2000s, there were major shifts in domestic mandates away from equity to fixed interest. In the last 15 years, the popularity of multi-asset unit trusts, which diversify across asset classes, has increased significantly, with South African multi-asset funds now representing 50% of local industry assets. As shown in Table 1, the number of unit trust management companies has virtually doubled in the last 20 years from 26 to 48, and the total number of South African unit trusts has increased six times from 186 to 1 227.
… some stay the same
Since inception of the firm, our investment philosophy has been to focus on the fundamentals of shares we invest in. We assess value from a long-term perspective, seeking to buy shares that are trading well below their intrinsic, or underlying, value. By intrinsic value we mean the value a sensible businessperson would ascribe to a company.
We adopt a multi-portfolio manager approach to managing our clients’ portfolios. This means that each portfolio manager is allocated a share of the pool of money to manage, and that investors get exposure to a blended portfolio of all of their ideas.
The portfolio managers are supported by a team of analysts, who research and recommend shares for a “buy list”. The portfolio managers act on their own conviction when selecting shares from the buy list, and they are held accountable for their individual decisions. Over the past 20 years, the number of portfolio managers managing the Equity Fund at any one point in time has ranged from three to five.
Managing succession – ensuring a seamless transition from one generation of decision-makers to the next – is critical and underpins our ability to deliver on our stated goal of generating long-term outperformance for our clients. Since 1998, we have seen four generations of decision-makers managing the Equity Fund, with each team simply passing the “baton” while the underlying process and philosophy remain unchanged. Today, Andrew Lapping, Duncan Artus, Jacques Plaut and Ruan Stander are the portfolio managers.
Shareholdings over time
The portfolio managers aim to create a diversified portfolio, investing in shares in which they have high conviction across all sectors of the stock market. Looking at the Equity Fund’s holdings from 1998, there are a few interesting takeaways. Most notable is that at inception, the Equity Fund, despite being small, was not particularly concentrated at a stock level. At 31 December 1998, AVI Holdings (AVIH) was the largest individual position at 5% of Fund, and there were 47 positions. AVIH was an industrial conglomerate with numerous listed subsidiaries. The AVI we know today, however, includes only a few of the consumer businesses previously held by AVIH.
The Equity Fund’s history also demonstrates the strengths of active management. There were numerous shares in the 1998 portfolio that have subsequently performed very poorly or gone bankrupt. Fortunately, many of these positions were sold when the portfolio managers deemed it suitable and the money was redeployed into new investments. For example, in 1998, the Equity Fund held a 7% position in the Altron group of companies; if this position was held until the eventual delisting, it would have been a terrible investment, but the position was sold during South Africa’s infrastructure boom in the early 2000s.
Over the long term, the compounding effect of above-average returns creates significant wealth for investors.
Today, the Equity Fund owns four companies that were also in the Fund in 1998, all of which have been sold to zero at a point in time, sometimes more than once. The companies are Sappi, Sasol, Naspers and Woolworths. The total annualised rates of return, with dividends reinvested for these shares since October 1998, are 13%, 21%, 32% and 24% respectively. These returns compare to the total Equity Fund return net of all fees of 22.4%. Naspers, the best performer of the four, was the largest holding among them in 1998 at 4.8% of Fund, but of the four it is the one we have held for the least amount of time over the past 20 years.
Although the Equity Fund invested only in domestic shares for most of its history, in March 2015, we broadened the mandate to allow investments in offshore assets. The Fund can invest a maximum of 30% offshore, with an additional 10% allowed for investments in Africa outside of South Africa.
Given that the South African market comprises around 1% of the global universe, the ability to invest in foreign equity allows the Equity Fund to benefit from further diversification and exposure to industries that are not well-represented on the JSE. We believe this will allow us to add more value for investors over the long term.
The Equity Fund invests the bulk of its foreign assets in equity funds managed by Orbis, our offshore investment partner. At end September 2018, the Equity Fund had a 29.4% exposure to foreign assets outside of Africa and 2.1% exposure to African assets outside of South Africa.
Risk of capital loss
The Equity Fund’s goal is to create long-term wealth for investors by investing in shares that offer the potential for higher returns over time. It aims to beat the average performance of similar unit trusts without taking any more risk. Investors in the Equity Fund must be prepared to accept the risk of capital loss, and be comfortable with volatile returns, especially over the short term, where a wide range of positive and negative returns over rolling one-year periods have been experienced since inception.
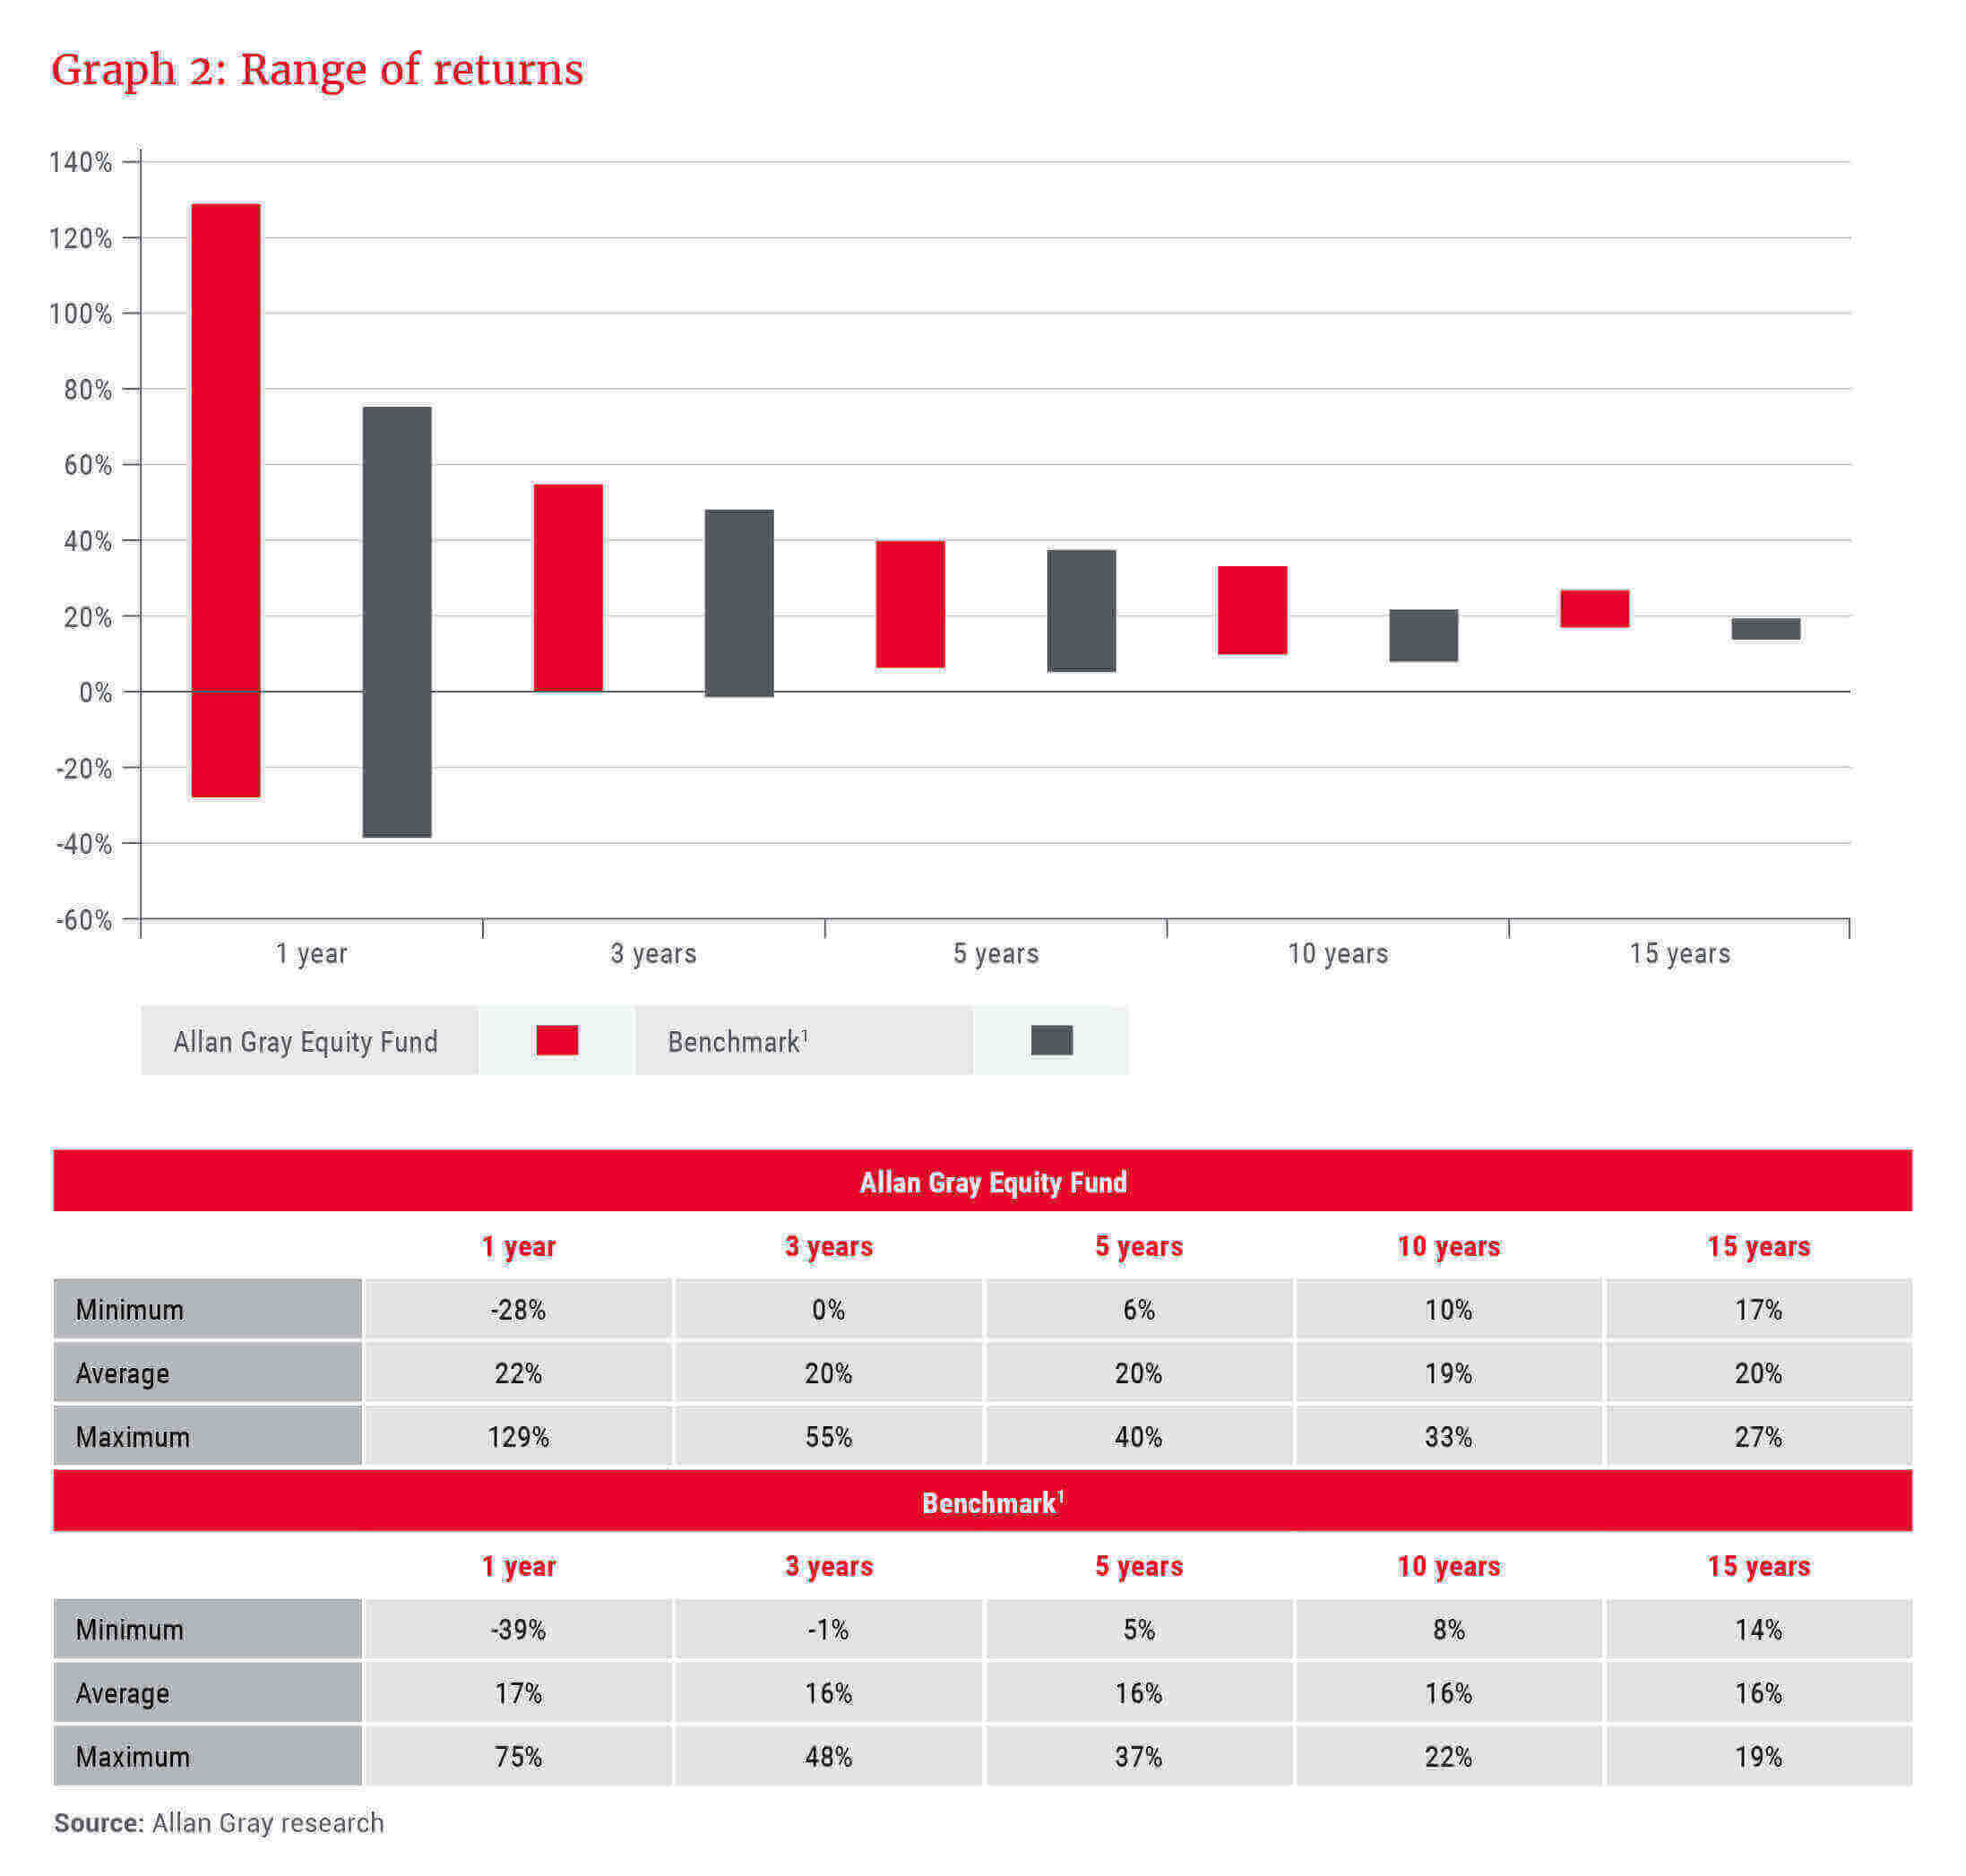
Graph 2 shows that volatility tends to smooth out over time. When we compare the Equity Fund’s range of rolling returns experienced over one-, three-, five-, 10- and 15-year periods with those of the benchmark, we see that as the period over which an investment is held increases, the range over which the returns extend decreases. The time horizon serves to mitigate the variability in returns.
The graph also demonstrates that the Equity Fund has consistently achieved higher upside in its returns than its benchmark, with lower downside risk. Over the long term, the compounding effect of above-average returns creates significant wealth for investors.
It also helps to understand our definition of risk. At Allan Gray, we define risk as the probability of a permanent loss of capital. We don’t see volatility as risk, as volatility only translates into a realised loss if an investor actually exits the Equity Fund. In looking at permanent loss of capital, we are not only concerned about the probability of capital loss, but also what the size of a loss might be. We can measure the potential size of future losses by looking at the maximum drawdowns of the Equity Fund over time. Maximum drawdown is the maximum decline in the investment performance (including income) over any period, i.e. the decline from a peak in the price to the trough.
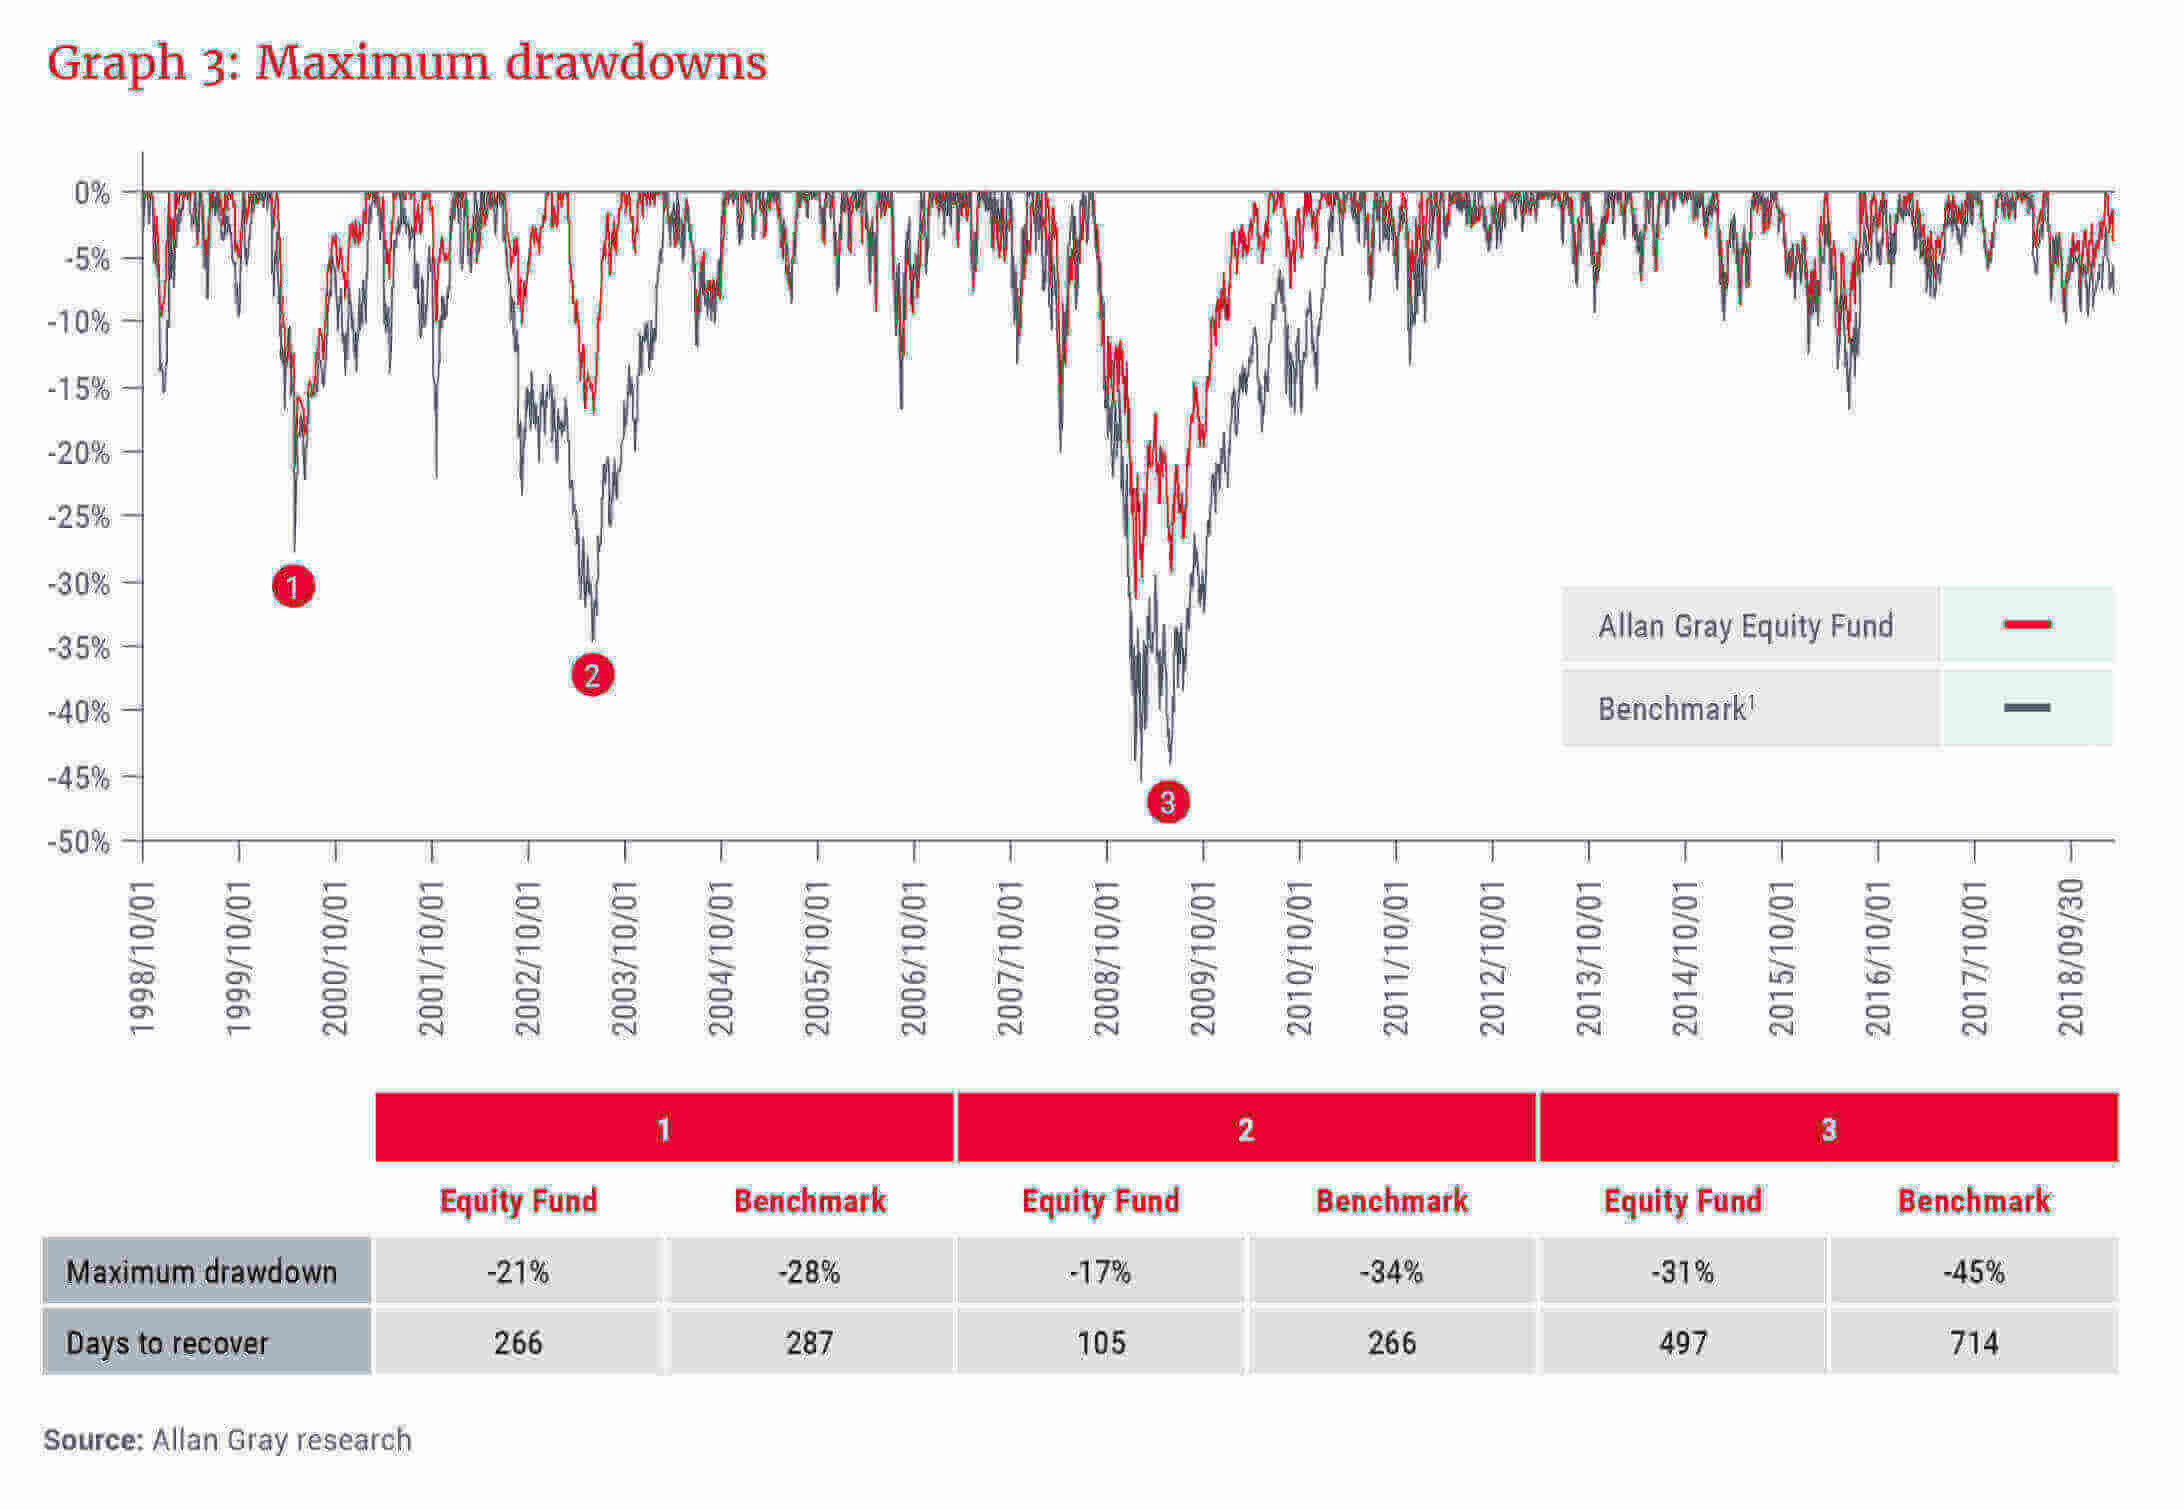
Graph 3 shows that the largest drawdown in the Equity Fund’s history was 31%, which would have been experienced by an investor who had been invested in the Equity Fund for the 160 days from 20 May 2008 to 27 October 2008. By comparison, the largest drawdown experienced by the benchmark (which at that time was the FTSE/JSE All Share Index) was 45% over the period 22 May 2008 to 20 November 2008.
Equally important is the time it takes a fund to recover from such a loss, which in the case of the Equity Fund was 497 days. The benchmark took 714 days to recover, almost 1.5 times as long. This reflects that the Equity Fund has taken on less risk to achieve its performance objectives.
It is useful to note that an investor who had remained invested for a five-year period commencing at the peak on 20 May 2008 would have received an annual return of 10.2%, despite this period including the largest drawdown experienced in the Equity Fund’s history. Inflation only returned 5.7% over this period. This demonstrates the importance of adopting a long-term approach, and not selling in panic and realising losses during a market downturn.
Investing for the long term
Investors who believed in the Allan Gray investment philosophy and chose to invest in the Equity Fund – including those Allan Gray employees who held on to their R1 000’s worth of units in the Equity Fund they received back in 1998 – have been well-rewarded, as shown in Graph 4. The annualised return of the Equity Fund net of all fees and expenses since inception has been 22.4% per annum, versus 15.5% for the benchmark.
Of course we must always remember that past performance is not necessarily a guide to future performance. However, history suggests that if you are prepared to accept a measure of higher risk, then higher exposure to equity over a long time horizon has the potential to deliver higher growth – but only if you have the stomach to ride out periods of market turbulence and remain invested for the long term.
A long-term track record is hollow if your clients don’t remain invested to enjoy the long-term outcome. As such, we aim to work with our clients, their advisers, consultants and other intermediaries to ensure we deliver excellent service, one of the hallmarks of which is to clearly and simply communicate our approach so that our clients can share the underlying conviction that we have in our approach, team and firm.
Trust is hard won, and easily lost. We look forward to the next 20 years of maintaining the trust that our clients have placed in us.