EXECUTIVE SUMMARY: Actively managed funds, including the Orbis Global Equity Fund, have struggled to outperform the market over the past year. Actively managed funds are able to beat the market because they are different from the market. In recent periods, however, share price movements have been highly correlated, so being different has not necessarily helped. Chris du Toit and Seema Dala look at how the smaller differences in returns between individual shares have impacted active fund managers.
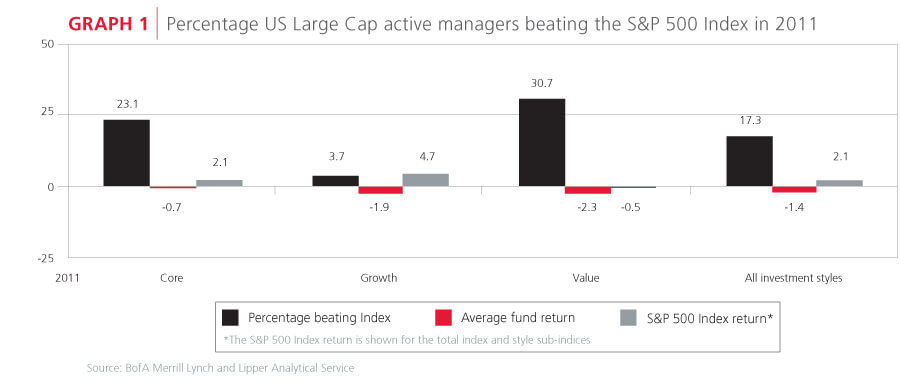
2011 was one of the worst periods of underperformance that active managers have experienced relative to their benchmarks and passive counterparts globally. According to a report by BofA Merrill Lynch and Lipper Analytical Service, only 17% of US Large Cap active fund managers beat the S&P 500 Index return during 2011 (see Graph 1). Managers with a ‘value’ style fared slightly better, with nearly one in three outperforming the Index. This is the worst annual performance by active managers since 1997 when only 12% outperformed the S&P 500.

Active managers try to outperform the market by investing in a selection of shares that they believe will do better than the overall market. Managers pick shares based on various methods, including researching the business fundamentals of companies to determine if their shares are cheap or expensive relative to their estimated true worth. It is impossible to pick the best shares all the time, as managers have imperfect information on which to base their research, and the future is uncertain. Successful active managers pick more outperforming shares than underperforming shares over long periods of time.
Why did active managers do so poorly in 2011?
One of the key assumptions active managers make, is that share prices should reflect economic realities over the long term. Shares may be underpriced or overpriced in the short term due to market participants overreacting to recent news, but the true value of a company as determined by its earnings power should be reflected in its share price once these overreactions subside. Benjamin Graham, the father of securities analysis, famously taught that the market ‘in the short term behaves like a voting machine, but in the long term acts like a weighing machine’. In the long term, individual shares should behave differently to the overall market, as their returns are driven by fundamental factors unique to each company. This is not always the case over shorter periods where the sentiment and expectations of the market often affect all stocks together.
Investors’ appetite for risk was severely shaken by the events of 2008/2009. Reeling from the financial crisis, investors as a whole largely fled the perceived riskiness of equity markets, with little or no consideration for which equity investments they were selling. For all intents and purposes, investors treated all shares as being the same. The impact on markets was an immediate increase in volatility and smaller differences in returns between individual shares.
THE MARKET IN THE SHORT TERM BEHAVES LIKE A VOTING MACHINE, BUT IN THE LONG TERM ACTS LIKE A WEIGHING MACHINE- BENJAMIN GRAHAM
To boost asset prices, central banks around the world, but especially the US Federal Reserve, injected massive amounts of money into the banking system, through various quantitative easing programmes (essentially printing money to lend to banks at very low interest rates). These policies have led to unprecedented levels of liquidity being released and seeking a place to be invested. Equity and bond markets, especially in the emerging markets, have been indiscriminate beneficiaries. Just as almost all shares were discarded during the crisis as a result of a massive liquidity shortage, the massive liquidity inflow by central banks has caused all shares to go up. Not only have markets been strong, the extent to which they have moved in unison has been unusual.
Fear and optimism
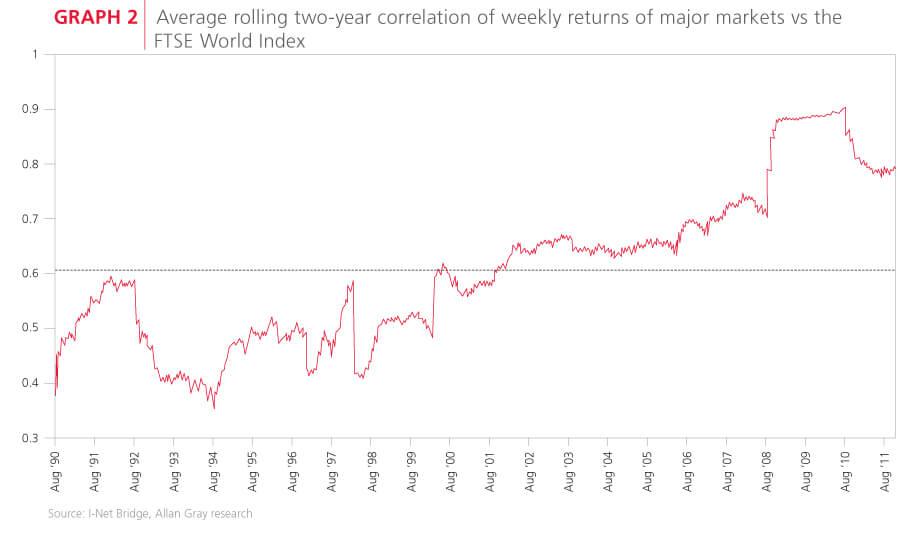
Graph 2 shows that, for 17 major markets globally, the average rolling two-year correlation of their weekly returns relative to the FTSE World Index is higher than its average of the last 20 years. Correlation measures its extent to which two assets (it could be two shares, or two market indices) move together, either up, down, or sideways. The higher the correlation, the more closely the two assets move together, with one being a perfect positive correlation – in other words two assets move exactly in line with each other.
 This high correlation has caused active funds, which distinguish themselves by being different from the market, to struggle to outperform, as being different has not necessarily helped. Of course, a high correlation between shares and markets does not explain underperformance by active managers. It merely shows that active funds would have found it more difficult to achieve different returns from the market, all else being equal. One can find further evidence of high correlations in the performance of the Orbis Global Equity Fund.
Orbis Global Equity Fund
The Orbis Global Equity Fund is actively managed and invested in a very concentrated portfolio of global shares. We fully expect the Fund to perform very differently to the market, especially in the short term. Orbis was not immune to the tough stock picking conditions of 2011, and during the year underperformed the FTSE World Index by 2.8%.
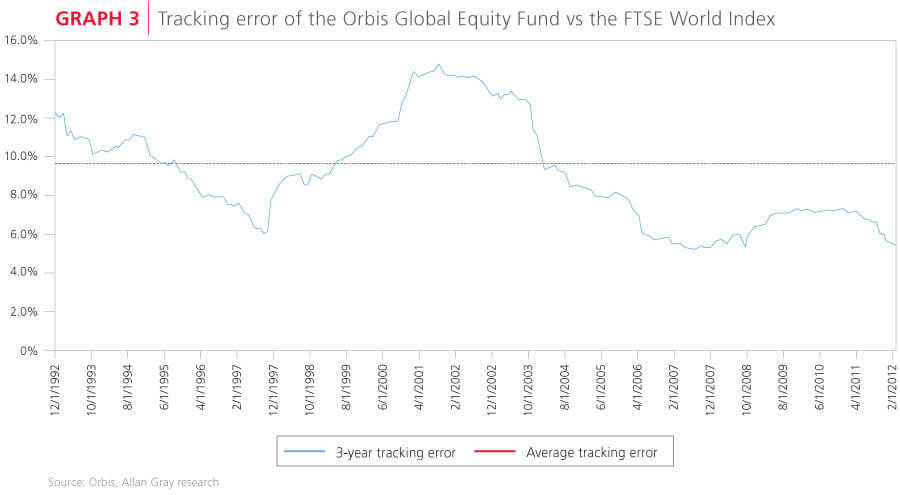
Variable short-term performance by actively managed funds versus their benchmarks is normal. Graph 3 shows the ‘tracking error’ of the Fund relative to the FTSE World Index measured over three-year periods since the Fund’s inception. Tracking error is a measure of how different a fund’s performance has been compared to its benchmark. The higher a fund’s tracking error, the more variable its returns are compared to the benchmark. Tracking error does not tell you if a fund has performed better or worse than its benchmark, merely whether or not its returns have been different. Note that the Orbis Global Equity Fund’s tracking error has been falling at the same time as the correlations between markets have been increasing.

THE MARKET MUST EVENTUALLY RETURN TO BEING A 'WEIGHING MACHINE', DRIVEN BY THE FUNDAMENTAL VALUE OF THE BUSINESSES IT REPRESENTS
Looking at the graph, one could conclude that the Orbis Global Equity Fund has started to invest more like the FTSE World Index because its tracking error is falling. However, tracking error is a function of two things: (1) how different your investments are from the market, and (2) how differently individual shares perform relative to the market. Number (2) is beyond a manager’s control, and has recently been affected by the liquidity injections described earlier. Number (1) is certainly within a manager’s control and, in the case of the Orbis Global Equity Fund, the differences to the market are as large as ever. The Fund is invested in only 83 stocks with 86% of the Fund made up of the 50 largest positions. Areas of particular concentration include Technology stocks, where the Fund has 34% exposure compared to 11% in the benchmark. There are also parts of the market that Orbis finds unattractive, including Basic Materials, where it has a 0% weighting compared to 8% in the World Index.
Difficult market conditions present active fund managers with an opportunity – once volatility in the market decreases, and correlations begin to normalise, fundamentals should begin to drive individual stock returns.
High correlations do not make it impossible to outperform the market, but they can make it more difficult and could last for some time. We do not know how and when these high correlations will end, but we do know that the market must eventually return to being a ‘weighing machine’, driven by the fundamental value of the businesses it represents.